How a Top DMO Used Data to Validate Booth ROI
- Panos Moutafis, Ph.D.

- Oct 2, 2025
- 4 min read
For any major exhibitor, especially a national destination marketing organization (DMO), the question of ROI looms large over every trade show. Investing in a significant booth presence with multiple engagement zones and off-site activations is a major undertaking. But how do you prove it worked? How do you move beyond counting people and collecting anecdotal feedback to understand true attendee engagement and brand impact?
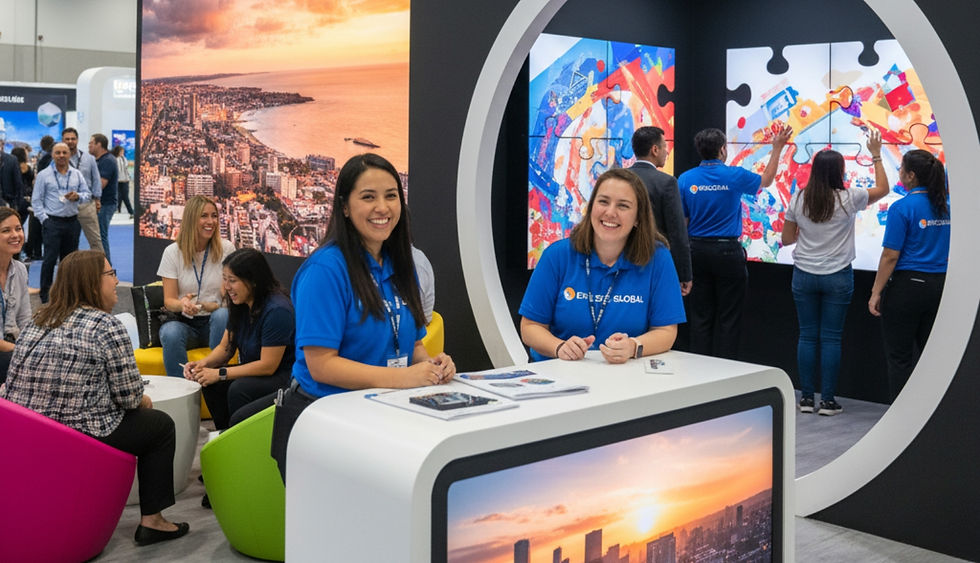
At a premier annual conference for association executives, a leading DMO faced this exact challenge. They had designed a sophisticated, multi-part experience, including a large main booth and a separate, interactive puzzle room activation. Their goal was clear: validate the impact of their investment and provide concrete data to their stakeholders. To do this, they partnered with Zenus to capture the objective data they needed.
The Challenge: Measuring Engagement Across a Complex Footprint
The DMO’s strategy at the conference was ambitious. Their main booth wasn't just a single space; it included:
A high-traffic hospitality and coffee bar
A dedicated partner engagement lounge
A new "Corporate Social Responsibility (CSR) Pavilion" with digital displays
In addition to this large footprint, they hosted a separate brand activation—an interactive puzzle room—in a different location on the show floor. This complexity created several measurement challenges:
Validating Traffic Flow: Were attendees exploring the entire booth, or just stopping for coffee? Was the new CSR Pavilion getting the attention it deserved?
Quantifying Brand Impact: Were visitors leaving with a positive feeling about the brand? Could they measure the excitement and energy of the experience?
Proving Activation Value: Did the separate puzzle room justify its investment? Was it attracting attendees and creating a memorable experience?
To answer these questions, the DMO needed more than just numbers; they needed insights.
The Solution: Ethical Facial Analysis for Deeper Insights
The DMO deployed six Zenus sensors across their two locations. Four sensors covered the key zones in the main booth, while two were placed at the puzzle room to measure engagement both in the queue and inside the activation itself.
Using privacy-first ethical facial analysis, the sensors measured key metrics:
Impressions & Traffic: How many people saw and entered the spaces.
Dwell Time: How long attendees stayed in each area, indicating depth of engagement.
Energy: The collective sentiment of attendees, measured through facial expressions, to quantify excitement and focus.

Zenus AI Metrics
This approach allowed the DMO to build a complete, data-driven picture of its performance.
Key Finding #1: The Booth Created Verifiable Excitement
The first data point told a powerful story. Attendees entering the DMO’s booth had an average energy score of 88%—significantly higher than the industry event benchmark of 80%. This wasn't just a feeling; it was a quantifiable fact. The combination of engaging staff, attractive design, and appealing offerings created a genuinely exciting atmosphere that resonated with visitors.
Furthermore, the average dwell time in the main booth was 7 minutes. This metric debunked the common exhibitor fear that attendees were just "grabbing swag and leaving." A 7-minute visit indicated that after getting their coffee, attendees were staying for meaningful conversations with the DMO’s team and partners, proving the booth was fostering valuable connections.
Key Finding #2: In-Booth Programming Delivered a Measurable Lift
Many exhibitors host happy hours, but few can prove their direct impact on attendee sentiment. During their networking reception, the DMO saw the average Energy across their booth increase by 2 percentage points. In the world of sentiment analysis, where data is averaged over thousands of interactions, a 2-point lift is a massive signal. It was clear proof that the reception wasn't just a nice-to-have; it was an effective tool for elevating the attendee experience and boosting positive brand association. During this time, energy in some areas peaked at an incredible 89%.
Key Finding #3: The Puzzle Room Activation Was a Resounding Success
Measuring the separate puzzle room activation provided some of the most compelling insights. The data revealed a story of building anticipation and excitement:
Aisle Energy: 84%
Puzzle Entrance/Queue Energy: 85%
Inside the Puzzle Room Energy: 86%

This steady increase proved the activation was working perfectly. It captured attendees' interest from the aisle, built anticipation while they waited, and delivered an engaging, high-energy experience inside. The average dwell time was approximately 4 minutes, hitting their goal of creating a quick, impactful, and memorable interaction.
Key Finding #4: From Data to Actionable Strategy
Perhaps the most valuable outcome was not just validating what worked, but also identifying opportunities for improvement. The data showed that on the first day, traffic to the puzzle booth regularly peaked about 30 minutes after traffic peaked at the main booth. This insight into the attendee journey confirmed that people were visiting the main booth first and then heading to the activation.
However, the overall traffic at the puzzle room was slightly lower than anticipated. Instead of a point of failure, this became an actionable insight. Armed with this data, the DMO can now confidently invest in better signage or other drivers for its next event, knowing it will guide more of its highly engaged main booth audience to the activation and maximize its impact.

Conclusion: The Power of Proving Your Impact
By leveraging Zenus's ethical facial analysis, this leading DMO transformed its event measurement from guesswork into a data-backed science. They successfully validated their significant investment at the conference, provided clear and compelling reports to stakeholders, and walked away with actionable strategies to make their next event even more successful.
They proved their booth created excitement, fostered deep engagement, and delivered a positive brand experience—and they have the numbers to back it up.
Ready to prove the impact of your next event? Contact our team at [email protected] to learn more.
*This article is based on a real-life deployment. AI tools were employed for editing and the creation of visual aids.


Comments