More Than a Feeling: The Event Organizer's Guide to Measuring Real Engagement
- Panos Moutafis, Ph.D.

- Nov 6, 2025
- 4 min read

In the dynamic world of professional conferences, the attendee experience is the ultimate currency. For a leading annual conference in the life sciences sector, delivering unparalleled value through its educational program is a core mission.
Traditionally, event organizers have leaned on post-event surveys and word-of-mouth to assess content performance. However, with declining response rates and the inherent biases of self-reported data, these methods can paint an incomplete picture.
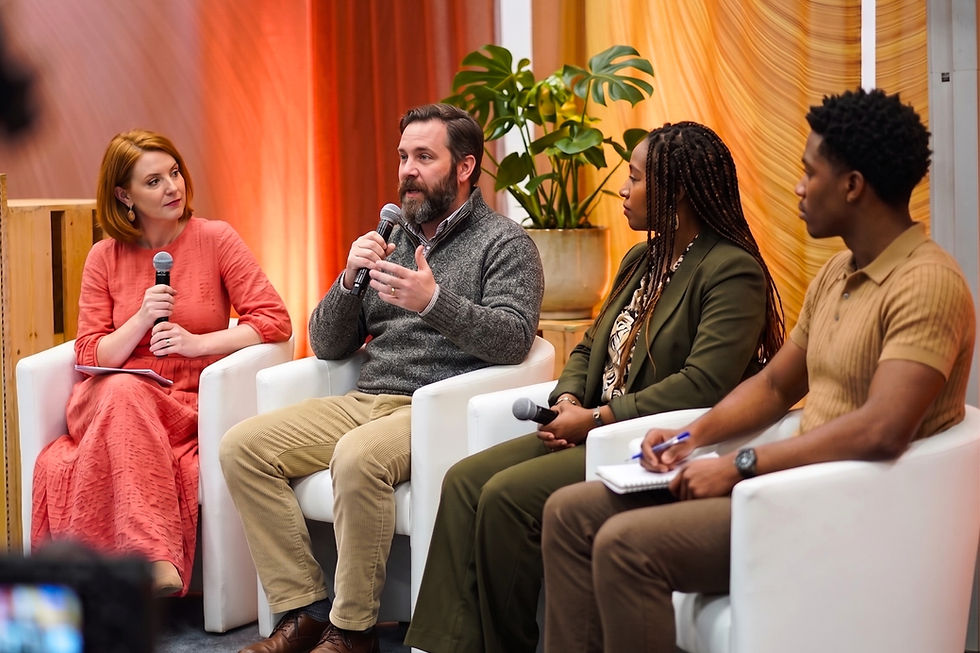
This major association sought to gain a more profound understanding of its attendee journey. The goal was to move beyond subjective feedback to answer vital questions: Which topics and speakers truly captivate our audience? Are our session formats resonating? How does our event schedule influence engagement levels? To uncover these insights, they partnered with Zenus, implementing ethical facial analysis to capture objective data on session engagement. This strategic move underscores a deep commitment to data-driven excellence, ensuring every element of their program is fine-tuned to maximize attendee value.
The Challenge: Quantifying Audience Engagement
The fundamental challenge for any large-scale event organizer is curating an agenda that is both informative and engaging. For this life sciences conference, that meant managing a complex program with multiple stages and specialized topics. The issue wasn't the quality of the content, but the absence of objective data to measure its impact. The organizing team needed a reliable way to:
Benchmark Session Performance: Without concrete data, it is challenging to determine if a keynote on the primary stage is more engaging than a niche technical presentation on a secondary stage, and why.
Understand Audience Sentiment: Surveys offer a look back. The association needed to see how audience energy ebbed and flowed during sessions to pinpoint the most effective content and delivery styles.
Evaluate Scheduling Choices: The event team had a strong intuition that certain scheduling decisions, such as the duration of breaks between sessions, had a significant effect on attendee focus and energy. They needed data to validate this hypothesis.
Shape a Future-Proof Content Strategy: With ambitious plans for future conferences, including a relocation to a new major event hub, the insights gathered now are foundational for creating the industry's most compelling and essential event.
The Solution: Capturing the Collective Energy of the Room

To address these challenges, the association integrated Zenus's facial analysis technology at its two primary educational stages. The entire process is rooted in a commitment to privacy; Zenus sensors analyze audience sentiment in aggregate, without recording any video or collecting personally identifiable information. The system translates thousands of anonymized data points into a clear and powerful metric: the energy score, which quantifies positive sentiment and active engagement.
By monitoring these scores, the event organizers could see a direct reflection of audience response. They could compare the average energy between different sessions, content tracks, and even demographic segments, creating a rich, multi-layered understanding of the attendee experience. This unobtrusive data capture method provided a comprehensive view of engagement from the entire audience, a far more reliable measure than the small subset of attendees who typically complete surveys.
The Resolution: Clear Insights for a Bolder Strategy
The data from the conference delivered more than just interesting statistics; it provided clear, actionable intelligence that empowered the association to double down on its attendee-centric philosophy.
1. Data-Backed Content Validation
The analytics quickly confirmed that the content on the primary stage was a powerful driver of engagement. It consistently earned a high average Energy Score of 82%, substantially higher than the secondary stage's 68%. This was no accident; the programming team had intentionally designed the main stage agenda to include more dynamic, debate-style sessions. The Zenus data provided the definitive quantitative proof that this strategy was highly effective.

2. The ROI of a Well-Timed Break
One of the most impactful discoveries was the direct link between break duration and audience energy. The data revealed that longer breaks between sessions led to a 13% average increase in the energy of the subsequent session. This was a crucial finding for the event's leadership team. It offered irrefutable evidence that allowing attendees sufficient time to network, recharge, and absorb information directly improves their engagement with the core educational content.

3. Pinpointing Winning Themes and Audience Interests
Deeper analysis of the data highlighted the specific topics that generated the most excitement. Tracks focused on "Emerging Market Dynamics" and "Supply Chain Optimization" were standout performers, drawing exceptionally high energy. Furthermore, the data showed that female and under-40 attendees often demonstrated higher engagement during sessions, with certain tracks proving especially popular with these key demographics. This level of granular insight enables the association to precisely tailor future content to not only meet but anticipate the interests of their diverse community.
Building the Event of the Future
By embracing ethical AI analytics, this life sciences association has solidified its reputation as an industry leader that listens and responds to its members. These data-driven insights are the voice of their community, transformed into a strategic roadmap. Armed with this intelligence, the content team can now confidently:
Champion audience-first programming with compelling, data-backed evidence.
Optimize the conference schedule to foster maximum learning and focus.
Innovate with new content tracks designed to engage key demographic groups.
Demonstrate clear event ROI to board members and stakeholders.
The success of this deployment signals a paradigm shift in event management—a move away from assumption and toward a deep, data-informed understanding of what truly makes an event unforgettable.
Are you ready to build your event's future on a foundation of data?
Contact Zenus at [email protected] to learn how ethical AI analytics can revolutionize your content strategy.
*This article is based on a real-life deployment. AI tools were employed for editing and the creation of visual aids.


Comments