Using Real-Time Data to Optimize Your Trade Show Strategy
- Panos Moutafis, Ph.D.

- Jan 20
- 3 min read
Mapping Intent: From Quick Stop to Deep Discussion
In the dynamic environment of a trade show, every minute of an attendee's time is valuable. For exhibitors, the difference between a quick stop and a long, meaningful conversation often comes down to understanding attendee intent.
The goal of a leading energy exhibitor at a recent national trade show was to ensure their highly trained staff were positioned exactly where the high-value conversations were taking place. Traditional methods offer little help with this in real-time. This is where the nuanced data from Zenus's behavioral analytics provided a critical, actionable insight.
The 4.0 Minute Mystery: Transactional vs. Intentional Stops
The exhibitor had several distinct areas: a main counter, multiple interactive kiosks, a hospitality station offering refreshments, and a separate meeting area. The initial hypothesis was that the Hospitality Station, a critical area offering coffee and refreshments, would see high traffic and high dwell time.

The Zenus AI data painted a different, more informative picture:
Hospitality Station: This area saw a very low average dwell time of just 4.0 minutes. The accompanying observation was clear:
"The Hospitality Station interactions were mostly brief, suggesting transactional stops as attendees grabbed coffee and moved on".
Deep Discussion Zones: In stark contrast, one specific kiosk area saw the longest stays, peaking at 8.1 minutes, while the main Meeting Area averaged 6.4 minutes.
This data immediately solved the "4.0 Minute Mystery". The hospitality zone successfully managed quick foot traffic and refreshment needs -a perfect transactional stop- but the high-value sales conversations were happening in the areas designed for sitting and interaction.

Real-Time Staffing Optimization
This clear distinction between short, transactional stops and long, intentional engagement allowed the exhibitor to immediately refine their booth staffing strategy.
Actionable Insight: Staffing a high volume of sales executives at the Hospitality Station would lead to wasted time and missed opportunities.
Mid-Show Adjustment: Sales and technical experts were re-prioritized to the areas that showed high intentional engagement and longer dwell times, maximizing their time with attendees who had already demonstrated a high intent to stay and engage.

This is a prime example of how real-time analytics provided a critical insight that no amount of pre-planning or post-show surveys could have captured.
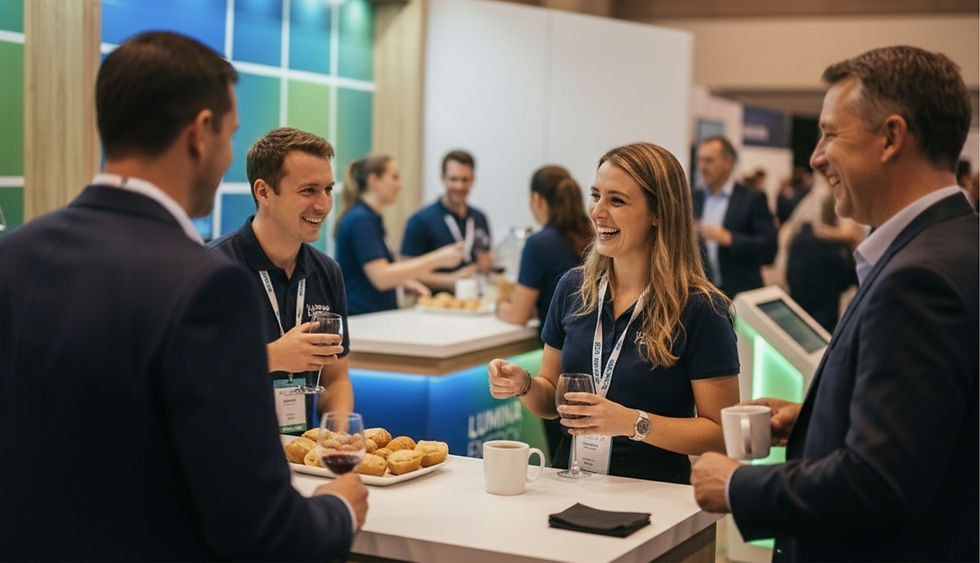
Leveraging Activations for Max Engagement
The analysis also provided powerful validation for a key social activation - their afternoon gathering. The overall booth energy score was consistently high, maintaining an 83% internal energy average. However, during the afternoon social hour (roughly 3 PM to 5 PM), dwell time across the entire booth increased sharply.
This confirmed the value of social activations. The resulting recommendation was to continue hosting social activations like the afternoon gathering to sustain energy and keep attendees longer. This data allowed the exhibitor to report to their leadership the full, measurable impact of their social programming, linking high energy and increased time spent directly to the afternoon schedule.

By utilizing Zenus's contextual data, dwell time by area, energy score by time of day, and traffic flow, this leading exhibitor was able to demonstrate that they are a responsible and thoughtful event partner, capable of making data-driven decisions that optimize the attendee journey for everyone involved.
Are you optimizing your staff and spaces with real-time insights?
Get the dwell time data you need to perfect your next booth staffing strategy.
Contact us today to request a free demo and get started on [email protected]
*This article is based on a real-life deployment. AI tools were employed for editing and the creation of visual aids.


Comments