
How an Industrial Products Brand Measures Booth ROI

At a premier annual architectural conference, a leading industrial products manufacturer deployed Zenus ethical facial analysis sensors to transform physical booth interactions into objective behavioral analytics. By tracking 13,528 aisle impressions, achieving a 39% stop rate, and discovering a peak dwell time of 9.4 minutes in high-value interaction zones, the exhibitor validated trade show ROI, optimized space utilization, and captured critical attendee insights without collecting personal data.

Why Do Traditional Trade Show Metrics Fall Short for Exhibitors?
Exhibiting at major industry conferences requires significant capital investment in booth design, floor space, collateral, and travel logistics. Despite these expenditures, trade show performance evaluation historically relies on lagging, incomplete metrics:
Manual Badge Scans: While badge swipes identify explicit leads, they miss non-scanned passing traffic, curious observers, and high-intent visitors who leave without scanning.
Low Survey Response Rates: Post-event surveys often suffer from low participation (frequently under 50%), thus introducing self-selection bias.
Subjective Staff Debriefs: Anecdotal impressions from booth staff fail to deliver quantifiable, executive-ready data regarding peak traffic hours, space utilization, or audience engagement levels.
To bridge the gap between physical interactions and quantitative ROI, forward-thinking exhibitors require continuous, passive analytics that track every attendee interaction along the booth journey.
How Does Zenus Ethical Facial Analysis Differ From Facial Recognition?
A major priority for corporate event teams is protecting visitor privacy while gathering meaningful behavioral data. Zenus utilizes ethical facial analysis; a passive, privacy-first technology that is fundamentally distinct from facial recognition.
FACIAL ANALYSIS vs. FACIAL RECOGNITION | |
Zenus AI | Traditional Facial Recognition |
Anonymous group metrics | Uniquely identifies individuals |
Local edge AI processing | Streams & stores video in the cloud |
Zero PII or video stored | Generates permanent biometric records |
No opt-in legally required | Mandates explicit individual consent |
GDPR & Article 9 compliant | Subject to strict biometric restrictions |
Zenus edge-computing sensors process optical input locally at the hardware level. The sensors analyze movement and aggregate the observations into statistical buckets. No video is recorded, saved, or transmitted, ensuring total compliance with global privacy frameworks like GDPR while delivering complete anonymity.
How Did the Exhibitor Measure Attendee Engagement at the Conference?
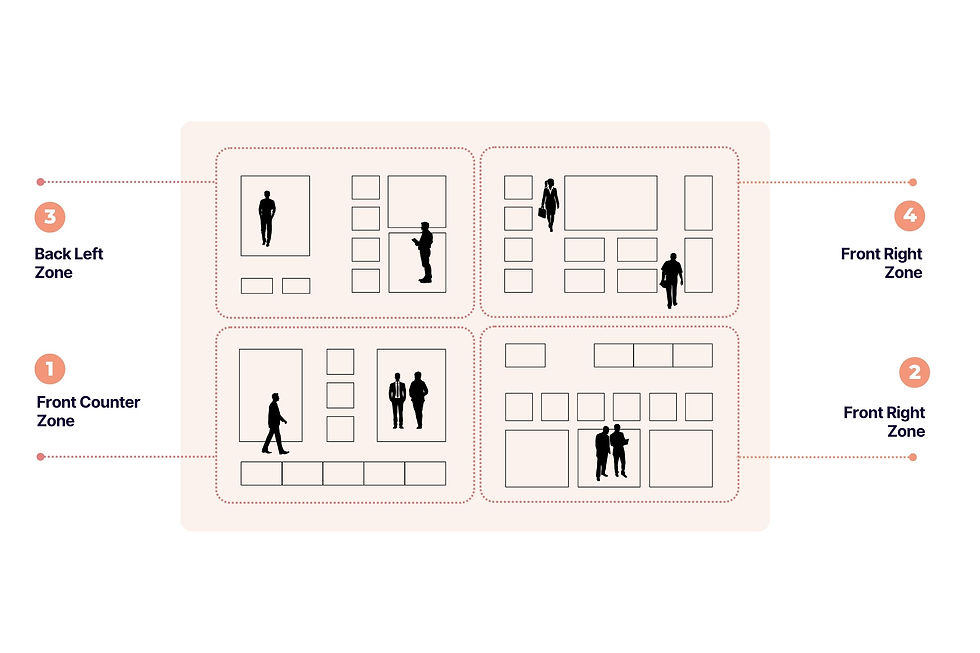
At a major trade show, a market-leading industrial products manufacturer sought to evaluate spatial design efficiency, quantify aisle visibility, and measure attendee engagement across their exhibit. The team installed Zenus privacy-first sensors across four designated quadrants within their exhibit footprint:
Front Counter: Positioned at the primary entrance for staff greetings and initial inquiries.
Front Right Zone: Dedicated to product demonstrations and detailed technical discussions.
Back Left Zone: Configured for secondary displays and overflow conversations.
Back Right Zone: Designed as an internal meeting and lounge space.
EXHIBITOR BOOTH PERFORMANCE & BENCHMARKS | ||
Metric | Exhibitor Result | Industry Benchmark |
Aisle Impressions | 13,528 | N/A |
Stop Rate | 39% | 36% |
Extended Visit Conversion | 37% | 33% |
Total Extended Visits (>1 Min) | 949 | N/A |
Average Dwell Time | 6.7 minutes | N/A |
Overall Internal Energy | 78% | 75-85% |
Over the course of the two-day event, the booth generated 13,528 aisle impressions and achieved a 39% stop rate which outperformed the Zenus industry benchmark by 3%. Furthermore, 37% of visitors who entered the booth converted into extended visits (dwell time exceeding one minute), surpassing industry conversion benchmarks by 4%.

Zone-by-Zone Performance Breakdown
By segmenting performance data across booth quadrants, the exhibitor identified exact traffic patterns and spatial engagement levels:
Front Counter (Top Traffic Driver): Generated 419 extended visits and reached a peak aisle energy score of 81%. Enthusiastic staff interactions at the counter successfully converted passing aisle traffic into active booth entrants.
Front Right Zone (Highest Depth of Engagement): Recorded 315 extended visits and an exceptional average dwell time of 9.4 minutes, exceeding the overall booth average of 6.7 minutes. This proved that visitors who engaged with product demonstrations were willing to commit significant time to deep discussions.
Back Left Zone (Consistent Secondary Engagement): Captured 174 extended visits with a healthy average dwell time of 6.2 minutes, serving as an effective secondary engagement hub.
Back Right Zone (Underperforming Quadrant): Produced 41 extended visits and an average dwell time of 4.1 minutes. The low utilization highlighted a clear opportunity to adjust layout architecture or reposition product displays for future shows.

How Can Exhibitors Use Behavioral Analytics to Maximize Event ROI?
The empirical data collected at the event provided the exhibitor with clear, actionable strategies to optimize future event operations and exhibit designs:
Eliminate Dead Zones in Booth Design: By identifying low-traffic areas like the Back Right zone, event teams can reallocate floor space, adjust lighting, or move key product displays to maximize spatial efficiency.
Align Staffing with Engagement Zones: Placing senior sales engineers in high-dwell areas (such as the Front Right zone) ensures that long, technical conversations are supported by appropriate experts.
Validate Executive Marketing Spend: Quantifiable KPIs such as impression volume, stop rate conversion, and internal attendee energy give leadership transparent proof of event success.

Benchmark Your Trade Show Performance with Zenus
Moving beyond manual lead counts requires objective, privacy-first behavioral analytics. By measuring attendee energy, traffic flow, and spatial dwell times, your organization can optimize exhibit design, empower sales teams, and prove true marketing ROI.
Ready to elevate your event analytics strategy?
Contact our team of experts today at [email protected] or visit www.zenus.ai to schedule a custom demonstration.
*This article is based on a real-life deployment. AI tools were employed for editing and the creation of visual aids.


Comments